Aroon Up/Down
Aroon Up/Down
Overview
The Aroon Up/Down indicator measures trend strength by identifying how recently price made a new high or low within a selected period.
It consists of two lines:
-
Aroon Up – Measures bullish strength
-
Aroon Down – Measures bearish strength
Values range from 0 to 100.
Settings
Parameters
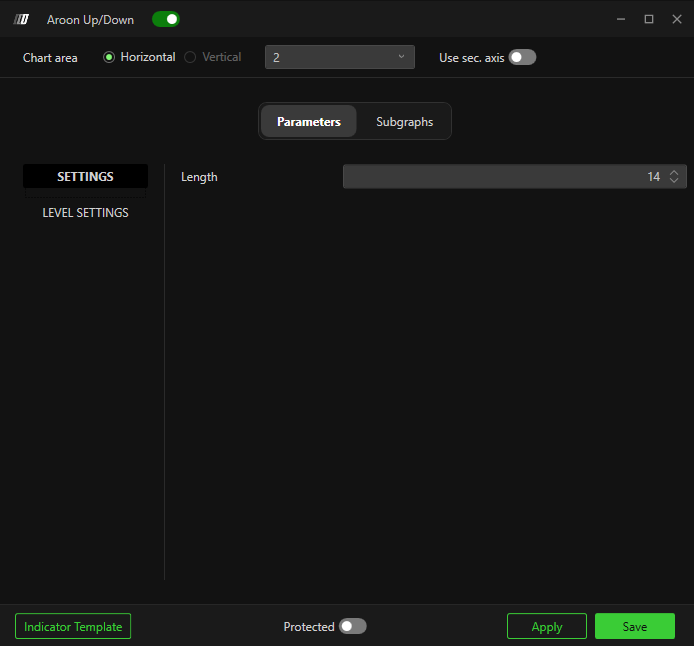
Settings
Length
Number of bars used in the calculation.
Default: 14
Lower values = faster signals
Higher values = smoother trend detection
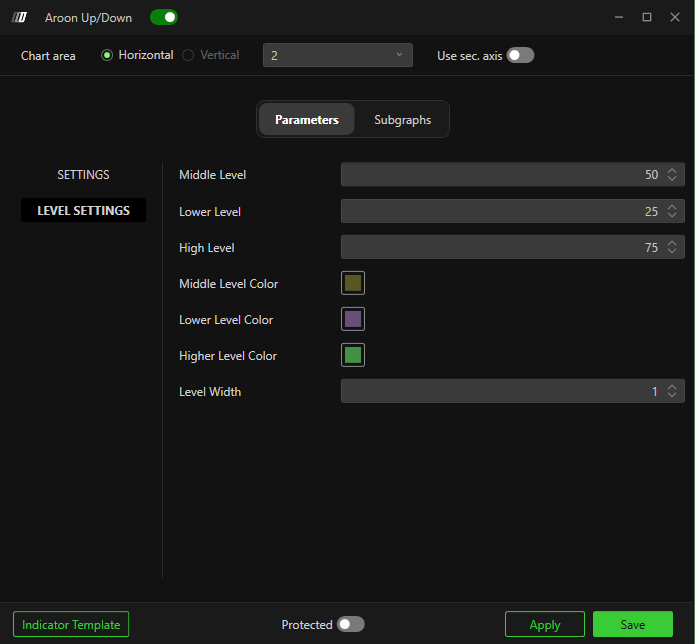
Level Settings
Middle Level – Default: 50
Represents balance between bullish and bearish pressure.
Lower Level – Default: 25
Indicates weak trend strength.
High Level – Default: 75
Indicates strong trend strength.
Middle / Lower / Higher Level Color
Customize level line colors.
Level Width
Adjust thickness of level lines.
Subgraphs
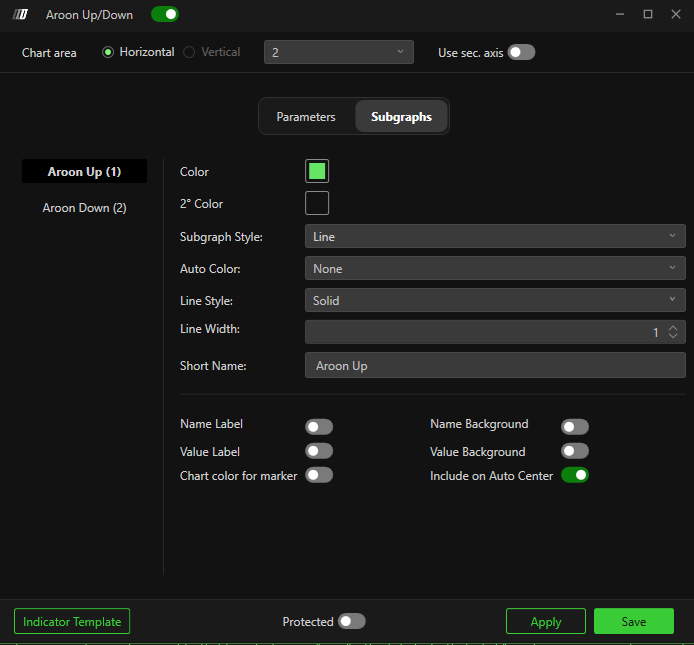
Aroon Up
-
Color – Line color
-
Subgraph Style – Line
-
Line Style – Solid (default)
-
Line Width – Thickness
-
Short Name – Custom label
Aroon Down
-
Same configuration options as Aroon Up.
Additional display options:
-
Name Label
-
Value Label
-
Name Background
-
Value Background
-
Include on Auto Center
Related Articles
Aroon Oscillator
Aroon Oscillator The Aroon Oscillator measures trend strength and direction by calculating the difference between Aroon Up and Aroon Down. It helps traders identify: Emerging trends Trend strength Potential reversals Overbought and oversold ...