Price Chart – DeepCharts
Open a New Price Chart
- Open Deepchart Software
- Make sure you are connected to Data Feed or Replay Tick Data
- Go here to open a chart: New > Price Chart
- Select your preferred exchange
- A new price chart window will open and build your data.
- Wait a few seconds until deepchart builds your data.
- You will see price chart like so:
Chart Management
Compact View
How to enable it:
Go to Options >> Settings >> General >> Chart >> Chart Tabs >> Compact Mode
How to add a chart:
Click the + (Add Chart) button at the top right of the chart window. A new chart tab will be created automatically and can be changed immediately.
How to modify a chart:
Right-click on the newly created tab and select the desired chart configuration.
Group Mode
Group Mode allows you to manage multiple charts together in a single window. All your open charts are listed and can be managed from one place.
How to enable it:
Go to Options >> Settings >> General >> Chart >> Chart Tabs >> Turn off - Compact Mode
How to add a chart:
Click the Add Chart button in the group panel. A new chart will be added to the group.
How to pop out a chart:
Click the arrow icon next to the chart name. This will pop the chart out of the group and give it a dedicated window.
How to remove a chart from the group:
Click the X icon next to the chart name. This will remove the chart from the group entirely.
Screenshot System
You can configure your preferred screenshot mode by going to Options >> Settings >> General >> Various >> Screenshot Mode
Auto Save - Automatically saves screenshots directly to your configured screenshot folder.
Save Dialog - Displays a save dialog each time a screenshot is taken, allowing you to choose where to save it.
Copy - Copies the screenshot directly to the clipboard so you can paste it into Discord, Telegram, Email, Documents, or Social media.
Copy and Auto Save - Performs both actions simultaneously — saves to folder and copies to clipboard.
Price Settings
mage)
PARAMETERS
General
- Days to Load
- Defines the number of days to load into the chart
- Param Type
- Minute / Second / Daily / Weekly / Monthly
Each bar is based on minute, second, daily, weekly, monthly. - Vol bars
Needing two parameters, Target and Reverse, the first parameter defines the Target in terms of the minimum tick that the bar must reach, once this minimum target is reached, the second parameter defines the Reverse in terms of ticks that the bar must make to create a new one. - Range
Defines the range in terms of ticks of each individual bar. For example, if a 10 Range chart is set, each new bar will be created whenever the price moves from high to low by more than 10 ticks. - Volume
Defines the maximum volume of each bar, reached that volume will create a new bar. - Trades
Defines the maximum number of trades of each bar, reached that value will create a new bar. - Renko
Similar to Range charts, defined a certain parameter in terms of ticks, say 10, a new bar will be created whenever the price moves 10 ticks from the body of the previous candle - Point figure
As Vol Bars need two parameters, Target and Reverse, the former defines the box size and the latter the reversal amount. When from the high or low of the candle there is a retracement equal to parameter 2 a new candle is formed. - Delta
Defines the delta, in absolute value, of each bar, once this value is reached a new bar will be created a new bar.
- Param 1
Defines the benchmark for time-based charts, Range, Volume, Trade, Renko, Delta, as well as the first parameter in Vol bars and Point figure charts. - Param 2
Defines the second parameter in Vol bars and Point figure graphs. - Based-on-minutes-data
Defines the type of data on which the construction of the graph is based. By default, the data source will be at tick, offering maximum accuracy in terms of traded orders, thus being able to define tick by tick whether a contract is executed in Bid or Ask, thus enabling delta calculation. It is recommended to enable the minute database when a very large data history has to be loaded, for longer period analysis. - Continuous contract
In the Futures it is possible to view the synthetic contract, which is that contract that combines the various maturities to which the futures themselves are subject, allowing the user to perform more long-term analysis; - None
No rollover is performed. - Date
The rollover is based on the time expiration of each individual contract. - Volume
The rollover is based on volume, that is, the moment more volume is recorded in the next contract than in the expiring contract, the rollover.. - Adjusted date
Makes the rollover based on time expiration and makes an adjustment to the historical price series based on the contango or backwardation between the expiring contract and the new contract. - Adjusted volume
Makes the rollover based on volume and makes an adjustment to the historical price series based on the contango or backwardation between the expiring contract and the new contract. - Exclude auction (tick data)
If enabled you exclude data arising at the opening and closing auctions. Useful option in stock markets to prevent volumes traded in those phases from offsetting volumes traded in continuous trading. Volume/Delta
- Volume
- Width based volume
When enabled, the width of the candles will vary depending on the volume exchanged in each bar. - % max width based volume
Sets the % maximum width of the candles based on volume - Delta
- Color based on delta
When enabled, the color of the candles will vary depending on the delta in each bar. Price Line
This is setting for current price line
- Enabled
If enabled, it will show current price line (see image) - Line Color
Sets the color for the price line. - Line Style
Sets style for the price line - Line Width
Sets width (size) of the price line - Extend line to left
When enabled, the price line shows to the left too. Countdown
This is setting for countdown for the next bar to form. You may move the box around by clicking on the box and dragging
- Enabled
When enabled, on the price chart, it will show the countdown box for the next bar to form (see image). - Text Size
Sets the countdown text size - Text Color
Sets the countdown text color - Back Color
Sets the color of the background of the countdown box
% Var
You may move the box around by clicking on the box and dragging
- Enabled
When enabled, on the price chart, it will show % variation from the closing price of the previous session.- Text Size
Sets the % Variation text size- Pos. Text Color
Sets the % Variation text color for positive variation- Neg. Text Color
Sets the % Variation text color for negative variation- BackColor
Sets the color of the background of the % Var box
Line Start Day
- Enabled
When enabled, on the price chart, it will show a vertical line on the start of a session - Line Color
Sets the session start line's color - Line Style
Sets the session start line's style (image shows style: Dash) - Line Width
Sets the session start line's width Custom Time Session (Exchange Time Zone)
- Enabled
When enabled, allows you to customize the session's start and end time, which is useful for highlighting in futures actionary session-only cash. The platform takes into account the market time zone, so to highlight the cash session in the futures quoted on the CME (Chicago Mercatile Exchange), you have to enter 09:30-16:00. - Ini Time
Set Initial Time for custom time session - End Time
Set End Time for custom time session
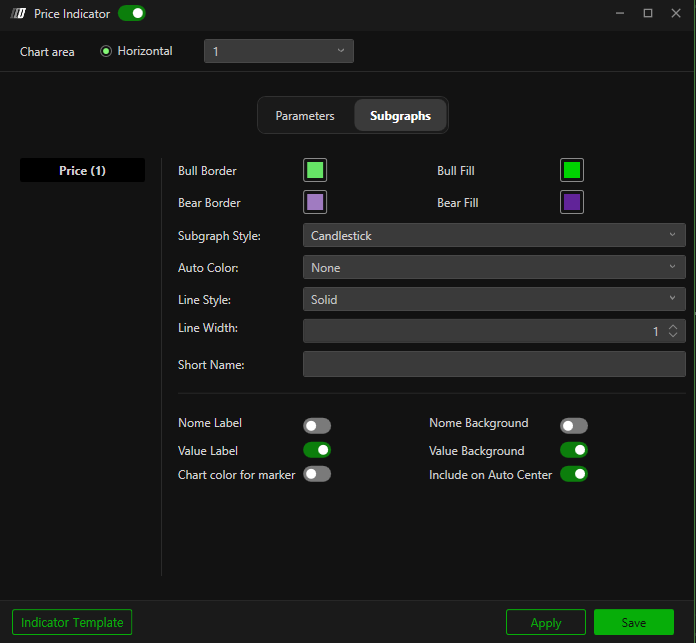
Subgraphs
Indicator Template
|
|
Indicators
Manage Indicators / Indicator Lists
- You can remove current indicator by clicking on the recycle bin icon
- You can hide the indicator by clicking on the eye icon
- You can change the settings of the indicator by clicking on the gear icon
- Chart Area defines where the indicators are placed on the price chart
- On the Price Chart, you can change the size of the chart area by clicking on the line where area is divided and dragging.
- Click on Indicators to see full Indicator List
- In the Indicator List, you can add preferred indicator by clicking on + button. Added Indicator will show on the right side.
- You can remove the added indicator by clicking on - button on the right panel.
- You can change the settings of the added indicator by clicking on the gear icon
- You can change the order of the indicator by dragging three line icon upward or downward.
Indicator Toolbar (Preset Indicators)
- OF-VP: Order Flow Volume Profile
- OF-B/A: Order Flow Bid / Ask
- D-VP: Daily Volume Profile
- D-DP: Daily Delta Profile
- D-VL:
- W-VP: Weekly Volume Profile
- W-DP: Weekly Delta Profile
- C-VP: Composite Volume Profile
Navigation on Price Chart
X-Axis
- To move the X-axis, simply make a scroll with the cogwheel of the mouse, alternatively click with the left button of the mouse on the timeline and drag.
- Auto Scroll : Right click on x-axis to set auto scroll which when enabled, the price will advance automatically as the bars advance.
- Double click or press play button on the bottom right (see image) to return the chart to the current bar (latest bar).
Y-Axis
- Auto Scroll: Right click on y-axis to set auto scroll which when enabled, the axis will follow the price if out of the current chart's view.
- Moving Y-Axis: Right click to see settings.
- Automatic Detection:
If you position yourself in the chart part of the Y-axis, pressing with the left button of the mouse you will be able to move the axis, while if you position yourself at the axis where prices are shown, up or down, you will be able to resize its size. - Move Axis Range:
Pressing with the left button of the mouse anywhere on the Y-axis (both chart and the price) will move chart up or down. - Resize Axis Range:
Pressing with the left button of the mouse anywhere on the Y-axis (both chart and the price) will resize price ranges.
Annotations (Drawings)
- You can right click on the chart to view/manage annotation tools
- For shortcut, you can find annotations on the left end of the price chart.
Pointer
- Enable Pointer (default)
Scope
- Enable Crosshair
Global Viewfinder
- Enable the crosshair global
- ability to simultaneously see the crosshair on all graphs of the same instrument present in the work plan
Hand
- Allows you to move the chart vertically and horizontally by clicking on the chart itself with the left button of the mouse.
Zoom Range
- Allows you to zoom in on a section you want. Left Click the start and Left Click the end section of the zoom.
Zoom Out
- Reset Zoom Range
Crosshair Window
- Opens Crosshair Window.
- Crosshair Window shows where you can see the details of where your crosshair is and range of information for each bar where you point the crosshair to it, such as High, Low, Open and Close or summation volume and summation trades (see image)
Drawing Objects
- Horizontal Line
- Vertical Line
- Horizontal Radius
- Line
- Parallel lines
- Rectangle
- Text
- Price Retracement (Fibonacci Retracement)
- Price Projection (Fibonacci Projections)
- Price Fan
- Volume Profile: Creates Volume Profile on your preferred section
- Buy Calculator
- Sell Calculator
Drawing Object Settings
Annotation Settings
- To open the drawing objects' settings, left click on the drawing and when you are scoped to the drawing, you can right click to open Settings. Go to Property to open Annotation Settings
- You can also double left click to open Annotation Settings
- You can change colors and styles in Annotation Settings.
Annotation Configurations
- Once you have set your settings, you can save the configurations for future uses.
- You can recall the configuration by clicking and right click on the drawing and opening Tool Config
Alert
Drawing Tools From Other Chart
- You can bring in the same drawings from other chart
Import/Export Annotation
- You can import / export annotation with saved files.
Rebuild Chart
- Reload the chart.
Template
- You can Load / Save the whole Price Chart Template
Properties
- You can change the colors (i.e. background), size, and name of the chart window
Related Articles
Price Chart Settings
1.Price Chart Settings The Price Chart in DeepCharts — whether shown as a candlestick or a line chart — is an indicator that helps you visualize the historical transactions of buyers and sellers based on the order book. You can fully customize how ...Live Feed Connected but Price Chart Is Not Moving
Live Feed Connected but Price Chart Is Not Moving Overview If your data feed is connected but the price chart is not updating, this usually happens due to market conditions, incorrect settings, or corrupted local data. Follow the steps below to ...Overlay Chart
The Deepcharts Overlay Chart indicator allows you to display the chart of another financial instrument on the main chart, allowing you to monitor multiple instruments at the same time. This can be done by creating a secondary chart area or by ...Trading from the Chart
Trading Features & Settings in DeepCharts allows you to trade directly from the chart, manage orders, and customize your trading panel. This guide covers everything you need to know to set up and use trading from your chart. Enable Trading To enable ...How to Connect DeepCharts dxFeed Datafeed
How to Connect dxFeed Datafeed Bought Through DeepCharts Website. 1. Sign the dxFeed Agreement Once you have purchased dxFeed, your credentials will be available in your dashboard after signing the agreement. Your username and password will be hidden ...