Volume Bubbles
Volume Bubbles
Why Volume Bubbles Matter
Most order flow tools show you numbers. Volume Bubbles show you the same information visually — making it immediately obvious where large executions are happening, in which direction, and how aggressively. You do not need to read a column of numbers to know that something significant just happened at a price level. A cluster of large bubbles tells you instantly.
Size tells you who is participating. Small bubbles scattered across the chart are noise — retail activity, small orders, nothing significant. But when you see a cluster of large bubbles forming at a specific price level, that is a signal that a meaningful participant is actively executing at that zone. And the color tells you their direction.
When you see a cluster of large blue bubbles, aggressive buyers are entering the market in size. When you see a cluster of large pink bubbles, aggressive sellers are hitting the market in size. When both colors appear in large size at the same level, there is a significant battle between buyers and sellers at that price — a level where the outcome will likely determine the next directional move.
The most powerful use of Volume Bubbles is watching for exhaustion. If price is pushing higher but the blue bubbles are getting smaller and pink bubbles are beginning to appear in size, buyers are losing conviction and sellers are starting to step in — often a sign that the move is running out of fuel before price has even turned on the chart.
Combined with the DOM and Heatmap, Volume Bubbles give you the complete order flow picture — the DOM shows you where orders are waiting, the Heatmap shows you where liquidity has been building, and the Bubbles show you exactly where and how aggressively the market is actually trading against that liquidity in real time.
How to Add and Configure Volume Bubbles on Your Chart
- Click the Indicators icon on the chart toolbar.
- Volume Bubbles will be added in the list by default.
- Click the settings icon on the indicator to open its configuration window.
Quick Access: You can also access the Bubble settings directly from the quick access toolbar at the bottom of the chart without opening the full settings window.
General Settings
Bubble Mode
Defines how the Volume Bubbles are displayed and colored on the chart. There are three options:
- Ask Bid Split — displays each bubble split between Ask and Bid volume separately, showing you the proportion of buying and selling within each execution.
- Delta — colors each bubble based on the difference between buying and selling volume at that execution. A strongly positive delta means aggressive buyers dominated that trade. A strongly negative delta means aggressive sellers dominated.
- Volume — colors each bubble based on the total volume of the execution regardless of direction. Use this when you want to focus purely on where the largest trades are happening without bias toward direction.
Filter Volume
Sets the minimum volume threshold for a bubble to appear on the chart. Any execution below this value will not be displayed. Use this to filter out small retail noise and focus only on executions that meet a minimum size threshold.
Filter Bubble
Sets the minimum size for an individual bubble to appear visually on the chart. This is a display filter — bubbles below this visual size will be hidden, keeping the chart clean and focused on meaningful executions only.
Volume Mode Color
Defines how bubbles are colored when Bubble Mode is set to Volume. Options include:
- Delta Absolute — colors the bubble based on the absolute delta value of that execution. The stronger the directional imbalance, the more intense the color.
- Delta Percentual — colors the bubble based on the delta expressed as a percentage of total volume. This normalizes the color across different size executions, making it easier to compare directional conviction across bubbles of very different sizes.
Sizing
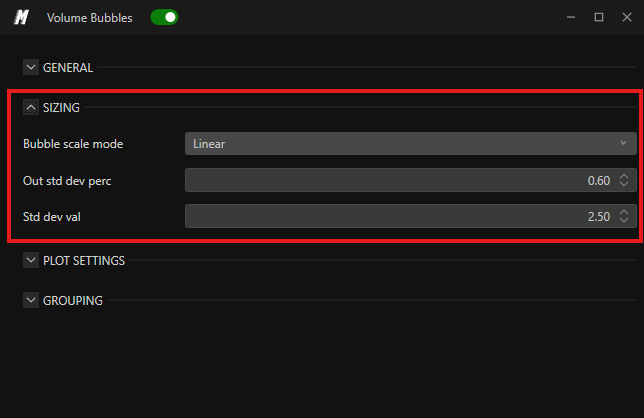
This section controls how the size of each bubble is calculated and scaled on the chart. This is one of the most important sections to configure correctly because how bubbles are sized directly affects how readable and useful the visual information is for your specific market.
The size of each bubble is calculated relative to the maximum bubble size present on the chart. This means the largest execution visible sets the reference point, and all other bubbles are scaled relative to it.
Bubble Scale Mode
Defines the mathematical method used to scale bubble sizes across the chart. This setting has a significant impact on how the bubbles look and how easy they are to read. There are three options:
-
Linear — bubble sizes are scaled in a direct, proportional way. If one execution is twice the volume of another, its bubble will be twice the size. This is the most straightforward scaling method and works well for futures markets where volume differences between executions are not extreme. However, in some markets, linear scaling can result in one or two very large bubbles dominating the chart while all others appear tiny and unreadable.
-
SQRT (Square Root) — bubble sizes are scaled using square root math, which compresses the difference between large and small bubbles. This makes the overall bubble distribution more uniform and visually balanced. If you are finding that linear scaling creates a chart where most bubbles are too small to read because one or two are extremely large, switching to SQRT will make the smaller bubbles more visible without losing the relative size relationship between them. This mode works particularly well for stocks where volume differences between executions can be very large.
-
Logarithmic — bubble sizes are scaled using logarithmic math, which applies the strongest compression of the three options. This creates the most uniform bubble distribution, making even very different sized executions appear in a more balanced visual range. Use this in markets where the range of execution sizes is extremely wide and you want the most readable display possible.
When to use each:
- Futures → Linear works well in most cases as execution sizes tend to be more consistent.
- Stocks → SQRT or Logarithmic is often better because stock volume can vary dramatically between executions, making linear scaling produce an unreadable chart.
Out Std Dev Perc Defines the outer standard deviation percentage used to control bubble sizing. This sets the boundary for how outlier executions — unusually large trades — are handled in the size calculation. A lower value makes the sizing more sensitive to outliers. A higher value absorbs them more smoothly into the overall scale.
Plot Settings
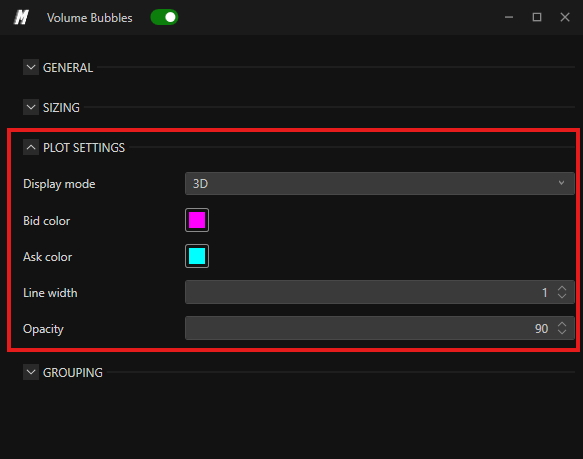
Display Mode Controls the visual style of the bubbles on the chart:
- 2D — bubbles are displayed as flat circles. A cleaner, simpler look that works well on busy charts where you want the bubbles to be visible without adding too much visual weight.
- 3D — bubbles are displayed with a three-dimensional shading effect, giving them depth and making them easier to distinguish at a glance, especially when bubbles of different sizes overlap.
Bid Color Sets the color of bubbles representing Bid side executions (market sell orders hitting the Bid).
Ask Color Sets the color of bubbles representing Ask side executions (market buy orders hitting the Ask).
Line Width Sets the thickness of the bubble outline. A higher value makes the bubble borders more visible, which can help distinguish individual bubbles when they cluster together at a price level.
Grouping
This section controls how individual executions are grouped together into single bubbles on the chart. Because the market produces thousands of individual trades every minute, grouping them into meaningful clusters makes the visual information far more readable and actionable.
Grouping Mode Defines the overall method used to group executions:
- Automatic — the platform automatically determines the best grouping based on current market conditions and chart zoom level. This is the recommended setting for most users.
- Time — executions are grouped based on time intervals. All trades that occur within a defined time window are combined into a single bubble.
- Price — executions are grouped based on price levels. All trades that occur at the same or nearby price levels are combined into a single bubble.
Price Aggr Mode Defines how price is aggregated when grouping bubbles:
- Extension — groups bubbles based on price extension only, moving in one direction. This means a bubble represents a sequence of trades that moved price in a single direction.
- Extension and Retracement — groups bubbles based on both price extensions and retracements, capturing moves in both directions within a single bubble group.
Tick Grouping Mode Defines how ticks are grouped within each bubble:
- Automatic — the platform automatically determines the tick grouping based on the instrument and market conditions.
- Fixed — you manually define a fixed number of ticks to use for grouping, giving you precise control over how granular or broad each bubble grouping is.
Conclusion
Volume Bubbles are one of the most visually powerful tools in DeepDom for reading real-time order flow. By showing you exactly where large executions are happening, in which direction, and with what level of conviction, they give you an immediate read on market aggression that numbers alone cannot deliver as quickly. Configure the Bubble Scale Mode correctly for your market, use the grouping settings to control the level of detail, and combine the bubbles with the Heatmap and DOM for the complete picture of what the market is doing at every price level.
Still Having Trouble?
Our support team is available 24/7 and ready to help you with any issue you encounter.
When reaching out, please include:
- A screenshot of the issue
- A brief description of what you were trying to do
Support Ticket (Fastest Response): Visit www.deepcharts.com and create a support ticket directly on our website.
Email Support: Reach us at support@deepcharts.com — please note that email responses may take a little longer than a support ticket.