ADR Target
Average Daily Range Target (ADR Target)
The Average Daily Range (ADR) target indicator calculates the average price movement (high to low) of an asset over a set number of days to project potential intraday price targets. It helps traders set realistic take-profit and stop-loss levels based on current.
It helps traders:
-
Identify realistic daily expansion targets
-
Estimate potential intraday exhaustion zones
-
Manage profit targets based on statistical range
-
Avoid overtrading beyond average volatility
Settings
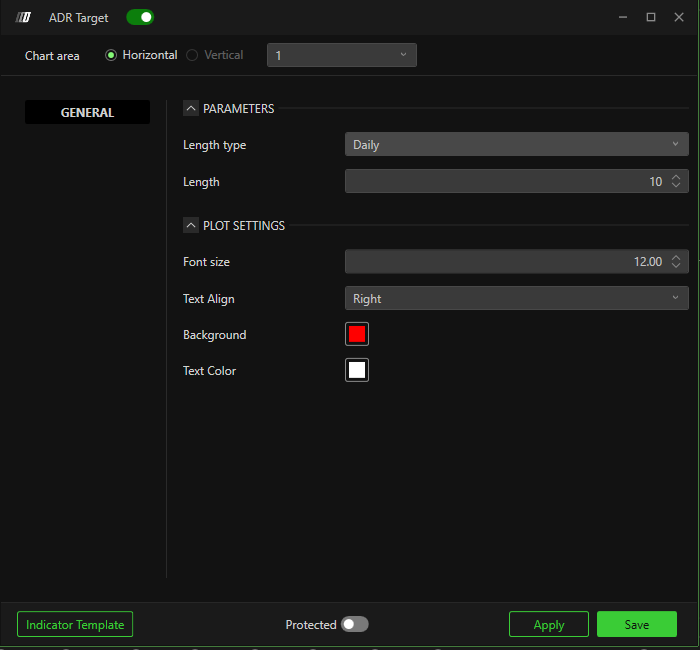
Parameters
Length Type
-
Daily – Calculates ADR using daily bars.
Weekly
Monthly
Length
Number of previous days used to calculate the Average Daily Range.
Example: Length = 10 → Uses the last 10 trading days.
Plot Settings
Font Size – Adjusts ADR label text size.
Text Align – Left / Right alignment of label text.
Background – Label background color.
Text Color – Label text color.
Related Articles
OCO (Order-Cancel-Order) Strategies
OCO (Order-Cancel-Order) Strategies The OCO Strategies allow you to attach two exit orders to a main order: Limit order for a potential profit exit Stop order for a potential loss exit Once one of the exit orders is executed, the other order is ...Overlay Timeframe Highlight
Overlay Timeframe Highlight The Overlay Timeframe Highlight visually highlights higher timeframe candles on a lower timeframe chart. It allows traders to: See higher timeframe structure without switching charts Track high/low ranges of larger candles ...Deep-M IVB
Deep-M IVB Deep-M IVB is an algorithmic indicator developed by the Deepcharts team to simplify trading the Opening Range Breakout (ORB) structure. The indicator analyzes years of historical data and automatically plots high-probability projection, ...Candlestick Bar
The Candlestick Bar indicator from Deepcharts allows you to overlay Japanese candles on top of the main chart. This powerful tool enables traders to analyze price action with customizable candlestick patterns and settings. Using Settings Clicking on ...Price Chart Settings
1.Price Chart Settings The Price Chart in DeepCharts — whether shown as a candlestick or a line chart — is an indicator that helps you visualize the historical transactions of buyers and sellers based on the order book. You can fully customize how ...